An image describing one of the visuals on the Data Visualization and Business Intelligence Services page created by Technotery which is Data Visualization and Business Intelligence Services.

Data Visualization helps businesses understand the significance of their data by placing it in a visual context so that they can grasp patterns, trends, correlations and contextual information easily. These insights can help them identify new opportunities, optimize business strategies and facilitate business management. Business Intelligence (BI) encompasses a variety of tools, applications and methodologies that enable businesses to collect data from their internal systems and external sources, prepare it for analysis, and create meaningful reports, dashboards and visualizations from the processed data. Technotery helps businesses integrate and deploy cross-functional Business Intelligence tools in their enterprise ecosystems which will deliver decisive insights, expressive visualizations and multi-faceted views of their data that go beyond static charts and reports. This actionable information in turn helps them in improving decision-making process, optimizing business process, accelerating sales and driving new revenues.

Retail

Healthcare

Supply Chain and Logistics

Industrial Manufacturing

Marketing

E-Commerce

Technologies

Our Technology Arsenal

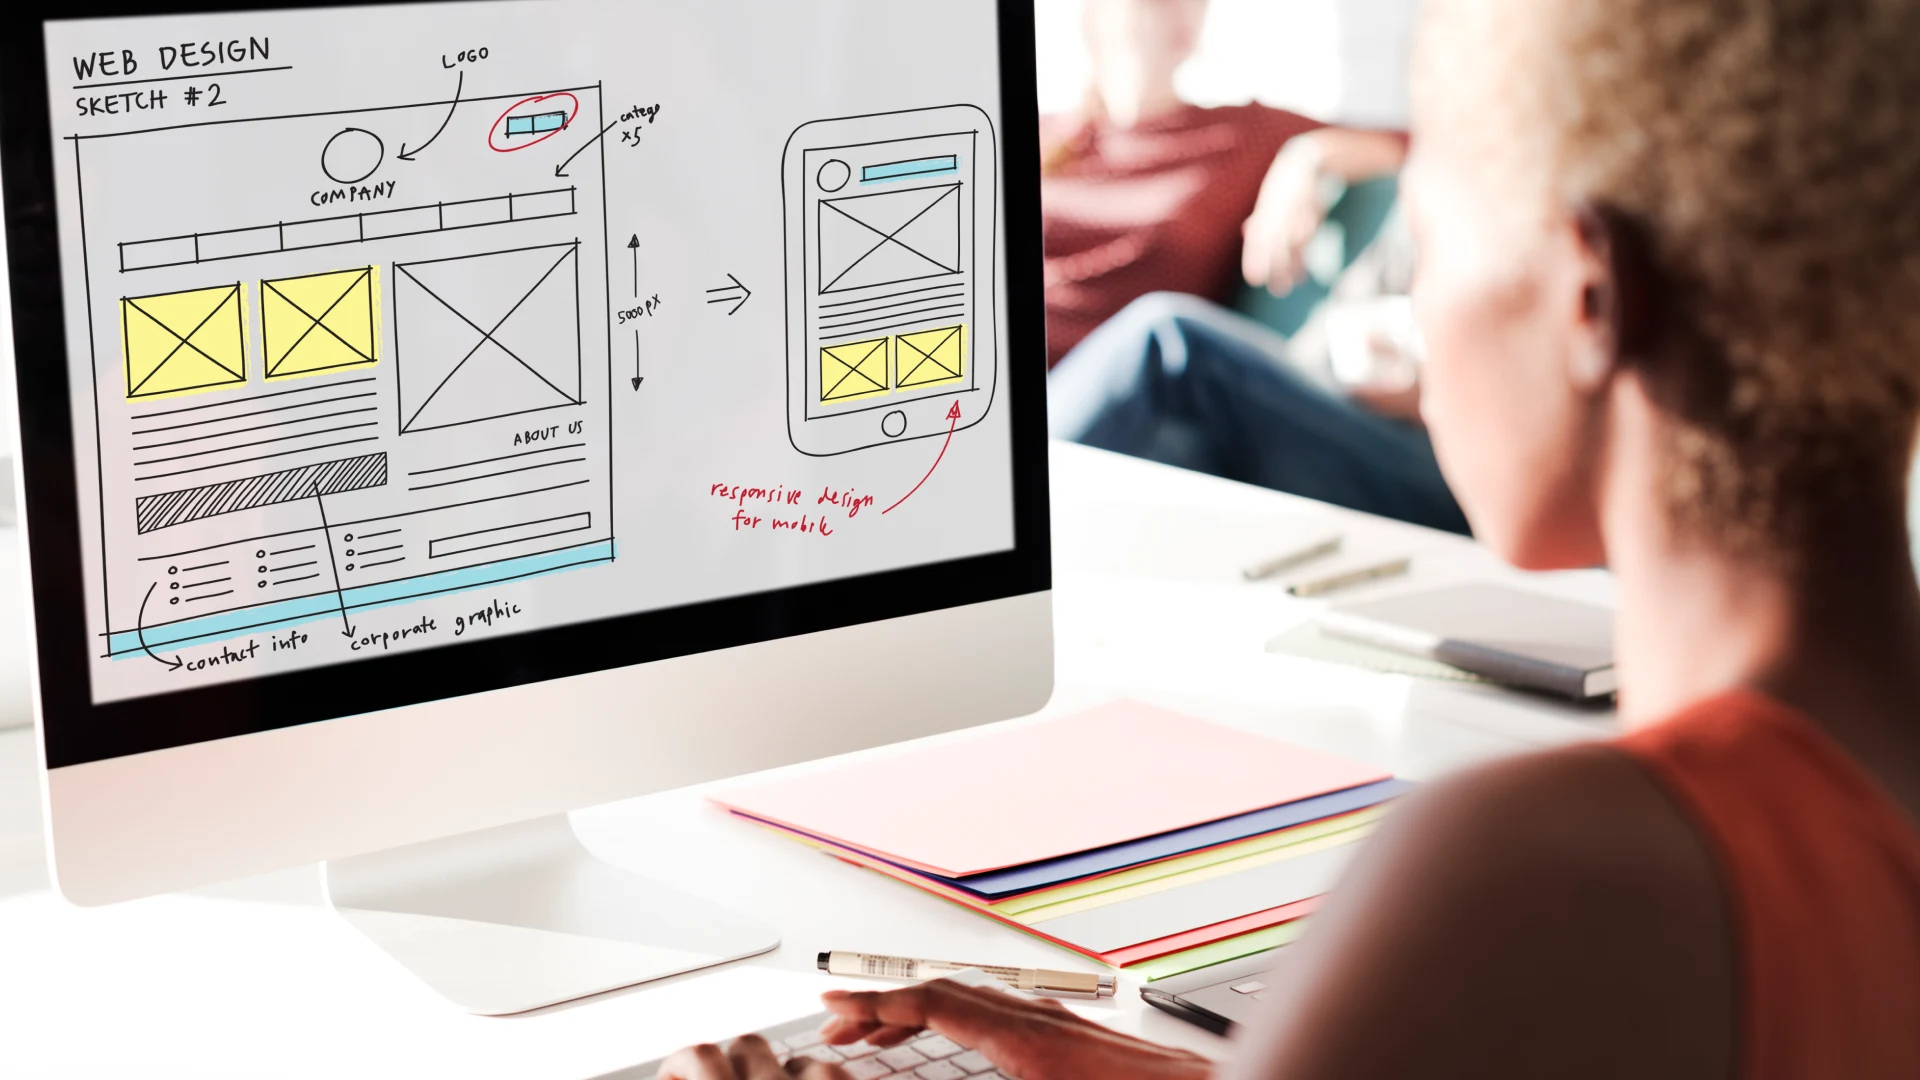
We architect with modern, enterprise-grade stacks — from React and Node.js to Python, Flutter, and cloud-native infrastructure. Every technology choice is driven by your business outcome.

An image describing one of the visuals on the Data Visualization and Business Intelligence Services page created by Technotery which is Python logo. Python
An image describing one of the visuals on the Data Visualization and Business Intelligence Services page created by Technotery which is Node.js logo. Node.js
An image describing one of the visuals on the Data Visualization and Business Intelligence Services page created by Technotery which is Express.js logo. Express.js
An image describing one of the visuals on the Data Visualization and Business Intelligence Services page created by Technotery which is Nest.js logo. Nest.js
An image describing one of the visuals on the Data Visualization and Business Intelligence Services page created by Technotery which is HTML5 logo. HTML5
An image describing one of the visuals on the Data Visualization and Business Intelligence Services page created by Technotery which is CSS3 logo. CSS3
An image describing one of the visuals on the Data Visualization and Business Intelligence Services page created by Technotery which is JavaScript logo. JS
An image describing one of the visuals on the Data Visualization and Business Intelligence Services page created by Technotery which is Bootstrap logo. Bootstrap
An image describing one of the visuals on the Data Visualization and Business Intelligence Services page created by Technotery which is React.js logo. React.js
An image describing one of the visuals on the Data Visualization and Business Intelligence Services page created by Technotery which is Next.js logo. Next.js
An image describing one of the visuals on the Data Visualization and Business Intelligence Services page created by Technotery which is Vue.js logo. Vue.js
An image describing one of the visuals on the Data Visualization and Business Intelligence Services page created by Technotery which is React Native logo. React Native
An image describing one of the visuals on the Data Visualization and Business Intelligence Services page created by Technotery which is WordPress logo. WordPress
An image describing one of the visuals on the Data Visualization and Business Intelligence Services page created by Technotery which is PHP logo. PHP
An image describing one of the visuals on the Data Visualization and Business Intelligence Services page created by Technotery which is Laravel logo. Laravel
An image describing one of the visuals on the Data Visualization and Business Intelligence Services page created by Technotery which is Figma logo. Figma
An image describing one of the visuals on the Data Visualization and Business Intelligence Services page created by Technotery which is Adobe Illustrator logo. Adobe Illustrator
An image describing one of the visuals on the Data Visualization and Business Intelligence Services page created by Technotery which is Adobe Photoshop logo. Adobe Photoshop
An image describing one of the visuals on the Data Visualization and Business Intelligence Services page created by Technotery which is ChatGPT logo. ChatGPT
An image describing one of the visuals on the Data Visualization and Business Intelligence Services page created by Technotery which is Claude logo. Claude
An image describing one of the visuals on the Data Visualization and Business Intelligence Services page created by Technotery which is Docker logo. Docker
An image describing one of the visuals on the Data Visualization and Business Intelligence Services page created by Technotery which is Kubernetes logo. Kubernetes
An image describing one of the visuals on the Data Visualization and Business Intelligence Services page created by Technotery which is AWS logo. AWS
An image describing one of the visuals on the Data Visualization and Business Intelligence Services page created by Technotery which is GCP logo. GCP
An image describing one of the visuals on the Data Visualization and Business Intelligence Services page created by Technotery which is MongoDB logo. MongoDB
An image describing one of the visuals on the Data Visualization and Business Intelligence Services page created by Technotery which is MySQL logo. MySQL
An image describing one of the visuals on the Data Visualization and Business Intelligence Services page created by Technotery which is PostgreSQL logo. PostgreSQL
An image describing one of the visuals on the Data Visualization and Business Intelligence Services page created by Technotery which is DynamoDB logo. DynamoDB
An image describing one of the visuals on the Data Visualization and Business Intelligence Services page created by Technotery which is Redis logo. Redis
An image describing one of the visuals on the Data Visualization and Business Intelligence Services page created by Technotery which is Jenkins logo. Jenkins
An image describing one of the visuals on the Data Visualization and Business Intelligence Services page created by Technotery which is Google Analytics logo. Google Analytics

Our Process

Application Development Process

Leveraging advanced technology and deep industry expertise to deliver scalable solutions.

01

Research & Ideation
An image describing one of the visuals on the Data Visualization and Business Intelligence Services page created by Technotery which is Research & Ideation.

We start by understanding your vision, market, and users to define a solid product strategy.

02

User Focused Design
An image describing one of the visuals on the Data Visualization and Business Intelligence Services page created by Technotery which is User Focused Design.

Creating intuitive and engaging interfaces that delight users and drive conversions.

03

Application Development & Integration
An image describing one of the visuals on the Data Visualization and Business Intelligence Services page created by Technotery which is Application Development & Integration.

Agile development and seamless integration with your existing systems.

04

Deployment & Testing
An image describing one of the visuals on the Data Visualization and Business Intelligence Services page created by Technotery which is Deployment & Testing.

Rigorous testing and automated deployment pipelines ensure a bug-free launch.

05

Maintenence Support & Enhancement
An image describing one of the visuals on the Data Visualization and Business Intelligence Services page created by Technotery which is Maintenence Support & Enhancement.

Continuous monitoring, support, and feature enhancements to keep your app compatible and competitive.

Blogs

Read our Latest news and expert insights

We are a team of passionate engineers and strategists dedicated to solving complex challenges.

An image describing one of the visuals on the Data Visualization and Business Intelligence Services page created by Technotery which is Cloud Cost Governance Blog.
20-01-2025
12:00 PM
Cloud Cost Governance for Multi-Account AWS Environments
Posted By: Vedang Shah

A practical blueprint for tagging standards, anomaly alerts, and policy guardrails that keep cloud usage predictable.

An image describing one of the visuals on the Data Visualization and Business Intelligence Services page created by Technotery which is AI-Ready Procurement Blog.
20-01-2025
12:00 PM
Building AI-Ready Procurement Workflows That Scale
Posted By: Vedang Shah

Learn how process mining, approval orchestration, and supplier intelligence reduce cycle time while improving procurement governance.

An image describing one of the visuals on the Data Visualization and Business Intelligence Services page created by Technotery which is RAG in Production Blog.
20-01-2025
12:00 PM
RAG in Production: Design Patterns That Actually Work
Posted By: Vedang Shah

Architecture choices for accuracy, latency, and trust across enterprise knowledge assistants and retrieval systems.

An image describing one of the visuals on the Data Visualization and Business Intelligence Services page created by Technotery which is Technotery Engineering Insights.
20-01-2025
12:00 PM
Explore More Engineering Insights
Posted By: Technotery Team

Browse our latest engineering perspectives on AI, cloud modernization, product delivery, and enterprise architecture.

Let’s Build Something Great

Have a project in mind? Tell us about it. We’ll respond within one business day with a roadmap tailored to your goals.

Technotery
Follow Us On:
Request A Demo